Printing Financial Statement Advanced (PRINTING A BALANCE SHEET AND/OR PROFIT & LOSS FINANCIAL STATEMENTS)
Have you looked over the Printing Financial Statement Basics KB article before attempting the following?
PRINTING A BALANCE SHEET AND/OR PROFIT & LOSS FINANCIAL STATEMENTS
Note******This document is only for use with Single Data Base accounts – IF your company has Multiple Data Bases and they share GAAP – additional information is required in order to run the financial statements correctly for each Data Base and as Consolidated. Please request assistance from Support or Training.**
To Print your financial statements go to General Ledger – Reports – Financial Statements – F6 and select the report that you want to print. The screen shot below is an example of the grid.
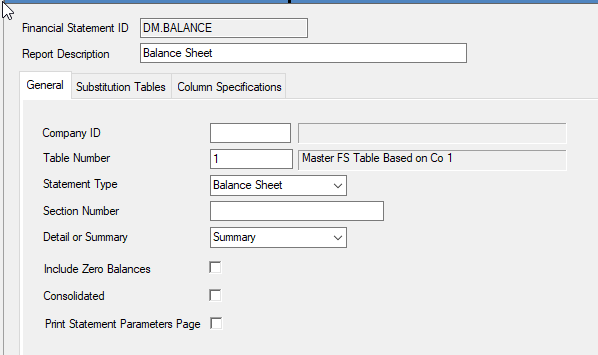
Once you select the statement you want to print you will need to make sure that it is going to print the information you are looking for. Next is information on printing a Balance Sheet. I am select DM.BALANCE from the grid. There are three tabs to review before printing your reports especially the Column Specifications.
- General Tab
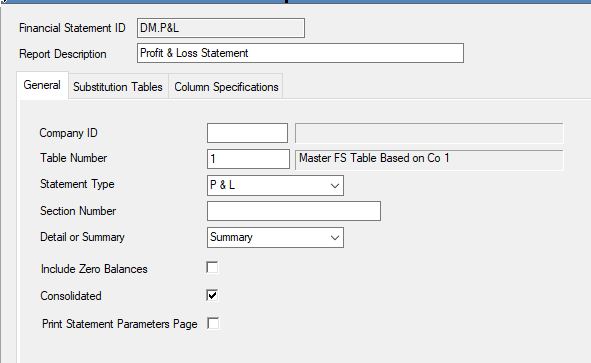
Here is the screen shot from the DM.P&L
- Company ID – This is not a required field but if you F6 and select your company ID then the Company Name will print on the Financial Report.
- Table Number – This is a required field. This tells the report which Financial Statement Table outline to use when printing the report.
- Statement Type – this is a required field. To print a Balance sheet you select Balance sheet. To Print a Profit and Loss Statement – you select P&L. DO NOT select Income Statement as this will only print Income type lines.
- Section Number – this is only used if your Financial Statement Table is formatted to allow you to pull out of it just specific line numbers. This is not a commonly used feature
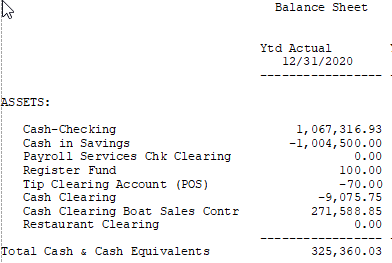
- Detail & Summary – Printing a report in Summary will print the Financial Statement Outline and populate the financial data based on the outline. Here is an example of what that will look like:
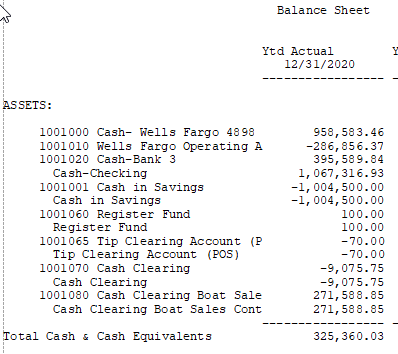
If you select to print in Detail then each general ledger account number that has a balance will print on the report along with the statement table outline. Printing in detail is usually done for internal use only. Here is an example of what that will look like:
- Include Zero Balances – if you check this box every line on from the Financial Statement Table will print on your report even if the general ledger account number associated with the line does not have a balance. Here is a snip-it of what that will look like:
-
Consolidated – This is mainly for the printing of the Profit and Loss statement and corresponds to the Second Tab – Substitution Tables. If you are using Cost Center account numbers in your Balance Sheet (this is not a common practice) then you would need to have a Substitution Table in the Second Tab and you would check the box to print Consolidated as this will print One Balance Sheet for the whole company. Most companies only use the Administrative Cost Center account numbers in their Balance Sheet so the use of Substitution Tables is not necessary.
-
Print Statement Parameters Page – if you check this box, it will print out these three tabs. You should do this at least once in case you mistakenly delete this report and need to set it back up again.
-
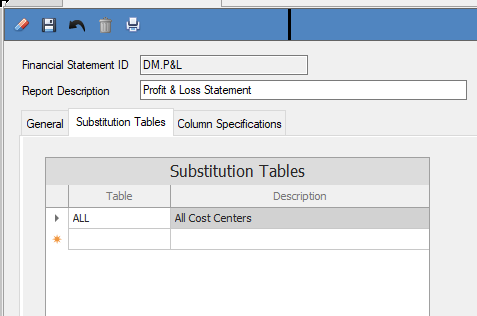
Substitution Tables:
The above is what would be the normal setting for both a Balance Sheet and a Profit & Loss Statement. A Substitution Table pulls in the cost center account numbers into the financial statements.
- Column Specifications: This is where you list what data you want to see in each column on the report. A Balance Sheet is printed showing Year To Date balances in the Asset, Liability and Equity accounts. The below screen shot is set that this Balance Sheet will print YTD data for 12/2020 and YTD data for 12/2021.
A Profit and Loss statement can be set up to report the data for what ever period you want in both the Period-to-Date (activity for just that month) or Year-To-Date (activity for the year up to that date). Below is the set up for printing the PTD for 12/2020 and the YTD for 12/2020.
- Function – this is where you select the function to use when printing/calculating the line. Print is the most common one used.
- Period – This is the period that the data will be pulled from. When you need to view the next month’s data you would Right Click anywhere on one of the lines and Select F8 to increase Period by One. This increases ALL lines on the grid by one period. F9 will decrease the periods by One if you need to look at a prior period. Changing the Date in the Heading 2 Column WILL NOT change the data being selected to print.
- Type: This is where you select if you are going to print Period-to-Date, Year-to-Date or Budget Net Values.
- The second set of “Period” and “Type” columns will only be used if you are using a Function such as “Subtract” where you are subtracting the values from one period from the values of another period.
- Factor – Default is a factor of “1”. You can print the data rounded if you select one of the other values
- Decimal – Decimal is the default but you select to Round or Truncate the data also.
- Width – You want to make sure each column is set with a high enough Width to accommodate the largest value that will be printed on the report.
- Heading 1 and Heading 2 – These will default based on what is selected in “Period” and “Type”. These values can be overwritten if you want to see some other verbiage.
You should be able to set up a report showing the columns of data you want to see on a report.
Please feel free to contact [email protected] if you need further assistance.

