Printing Financial Statement Basics
Printing Financial Statement Basics
General Ledger>Reports>Financial Statements
Right Click or F6 to list statements..
There are 2 Defaults:
- Balance Sheet
- Profit & Lost Statement
Balance Sheet
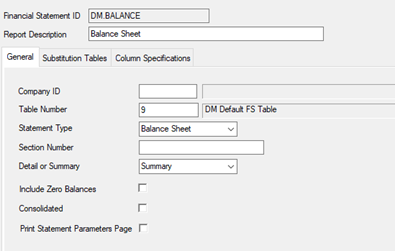
General tab:
The current table = 9 (Default Statement is One line per GL Account, there are not roll ups here)
Statement Type = Balance Sheet
Detail or Summary = Summary (you can use Detail if you need to see the GL Account #)
Substitution Tables tab:
Nothing to do here for Balance Sheet
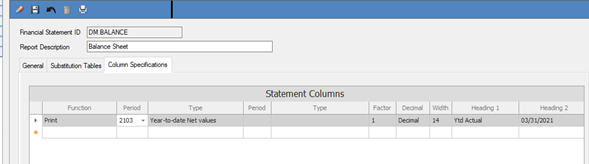
Column Specifications:
Here you can choose what “Period” ending to get YTD Net Values of the balance sheet.
If you right click on the period dropdown you can increase or decrease a period by one or select from the dropdown.
Note: Periods are 2103 = March 2021. (first 2 year digits, second 2 month)
On the balance sheet, it is always Year to Date Net Values.
Can add prior years and do comparisons if desired.
Profit & Loss Statement
General tab:
The current table = 9 (Default Statement is One line per GL Account, there are not roll ups here)
Statement Type = P&L *there are other choices
Income Only
Expense Only
Departmental, (Side by Side for each cost center)
Detail or Summary = Summary (you can use Detail if you need to see the GL Account #)
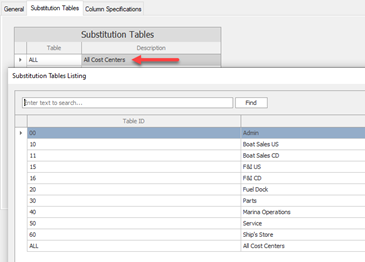
Substitution Tables tab:
Currently set to ALL Cost centers. Here you can pick and choose specific cost center(s) to see individual P&L’s (for example Service only)
F6 to see a full list. You can choose 1 or more.
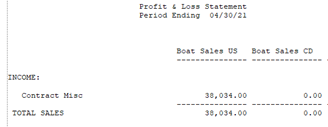
To do the departmental P&L whatever you choose here will be in its own column:
Example: I Picked ONLY 10 and 11 and you can see the numbers side by side:
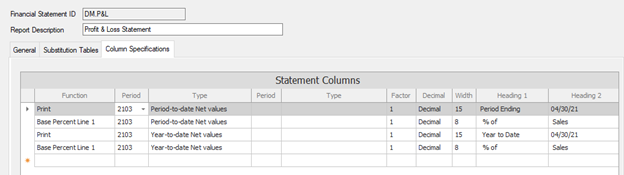
Column Specifications:
Here you can choose what “Period” ending to get PTD and/or YTD Net Values.
If you right click on the period dropdown you can increase or decrease a period by one or select from the dropdown.
Note: Periods are 2103 = March 2021. (first 2 year digits, second 2 month)
Also if you increase or decrease using the Right click from the top in will Increase or Decrease all lines below.
Here we are showing March 2021 PTD and YTD:
Base Lines are just percentages of another line:
Example: xxx sales are x% of Total Sales.. (explained on the table format I sent)
Once you start getting some history, we can do comparisons LY MTD vs TY MTD, or LY YTD vs TY YTD.. etc
We can also do Quarterly Statements etc.. and you can build as many of these as you wish, so you don’t have to change the Columns specifications each time you want to print.
For now.. these are the 2 basic reports.
Like all other reports in DockMaster, click the printer icon and print, or save to excel etc.
**If at any point you run into any issues, feel free to email [email protected] for assistance.**
For an advanced guide at Printing Financial Statements see the following KB PRINTING A BALANCE SHEET AND/OR PROFIT & LOSS FINANCIAL STATEMENTS